Debre Zeit Community Religious Following:
Various religions are practiced among the members of the Debre Zeit Community. According to the 2007 population census, slightly over three quarters (79.7%) of the community are Orthodox Christiane followed by protestants which account for 13.8 percent.
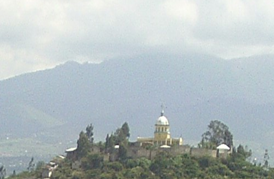
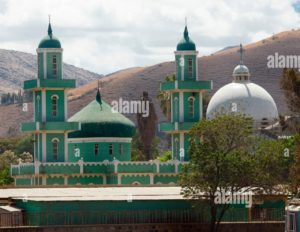
St. Rufale Church: One of the three Orthodox church and Mosque in Debre Zeit


What is interesting is as we move away from Debre Zeit into The Oromia Zone, the share of the community members who are Christians shrinks, while the share of those who are Muslims rises significantly. In fact at the Oromia Region level, the community members who are Christians (Orthodox + Protestants + Catholics) and Islam were close to half and half with Christians slightly ahead.
The most dramatic change is the drop in share of Orthodox Christians at the Oromia Regional level from about 80% in Debre Zeit to 30% at the Oromia Region level. Conversely, the Muslim share rises to 47.5 % at the Oromia Region level compared with Only 5% in Debre Zeit.
| % Share of the religions | |||||||
| BISHOFTU/TOWN/-WEREDA | Orthodox | Protestant | Catholic | Islam | Traditional | Christian | Islam |
| Both Sexes | 79.7% | 13.8% | 0.5% | 5.0% | 0.4% | 94.0% | 5.0% |
| Male | 79.5% | 13.2% | 0.5% | 5.6% | 0.5% | 93.2% | 5.6% |
| Female | 80.0% | 14.4% | 0.4% | 4.4% | 0.2% | 94.8% | 4.4% |
| EAST SHEWA ZONE | |||||||
| Both Sexes | 69.5% | 8.4% | 0.5% | 16.2% | 5.1% | 78.4% | 16.2% |
| Male | 69.3% | 8.6% | 0.6% | 16.1% | 5.1% | 78.4% | 16.1% |
| Female | 69.7% | 8.2% | 0.5% | 16.3% | 5.0% | 78.4% | 16.3% |
| OROMIA REGION | |||||||
| Both Sexes | 30.4% | 17.7% | 0.5% | 47.5% | 3.3% | 48.6% | 47.5% |
| Male | 30.5% | 17.4% | 0.5% | 47.7% | 3.3% | 48.4% | 47.7% |
| Female | 30.3% | 18.0% | 0.5% | 47.4% | 3.3% | 48.7% | 47.4% |
For further analysis, we have provided the complete table with actual numbers of followers of the different religion broken down by town (Debre Zeit), Zone (East Shewa) and Region (Oromia)
[table id=10 /]